In late November of 2018, while iterating on BillMarket, We started defining a standalone business credit insights dashboard. We wanted to expand on the existing offering with more insights and metrics provided by Equifax. We launched an agent-assisted pilot version on March 10, 2019, with our partners at Money Mart. The final self-serve version and landing page launched in late June.
While building BillMarket, we ran some surveys to existing and prospective customers. We wanted to get a better understanding of how knowledgeable business owners are about their current business credit health. Here is what we derived from those surveys:
The idea from the early stages was to create a product that would fit into the eventual all in one portal we had been planning since creating BillMarket.
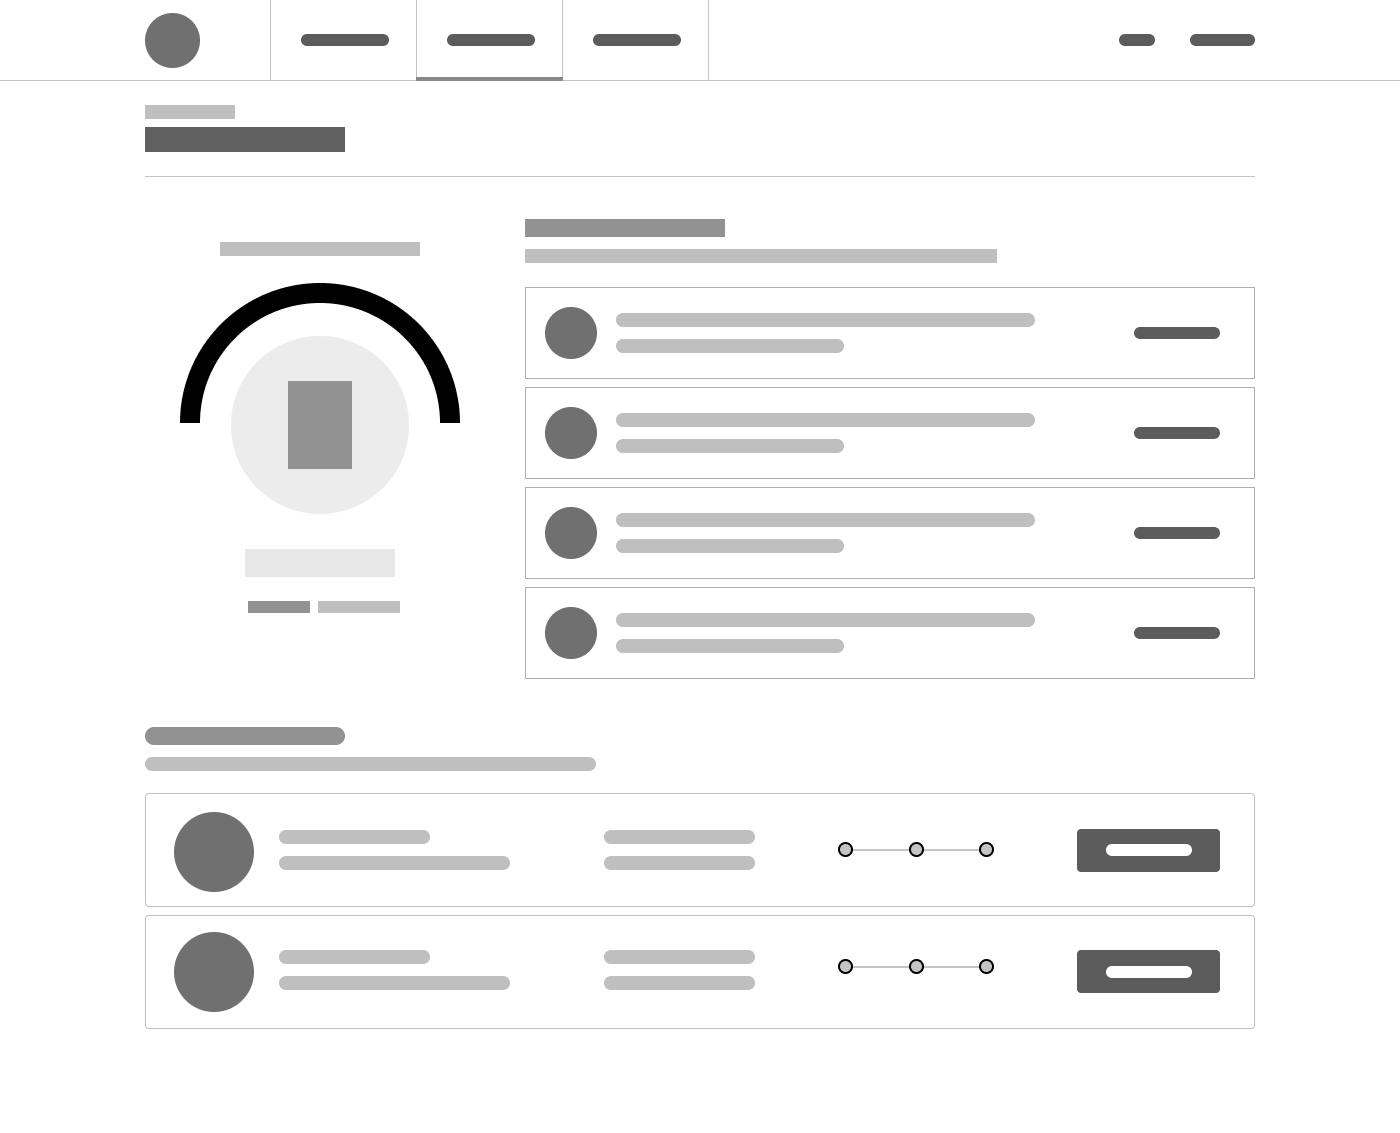
I started the exploration process by creating wireframes for our future seamless experience. The wireframes helped me explore variations for the credit dashboard. All the wireframes became the foundation for the remainder of the project and the subsequent portal project.
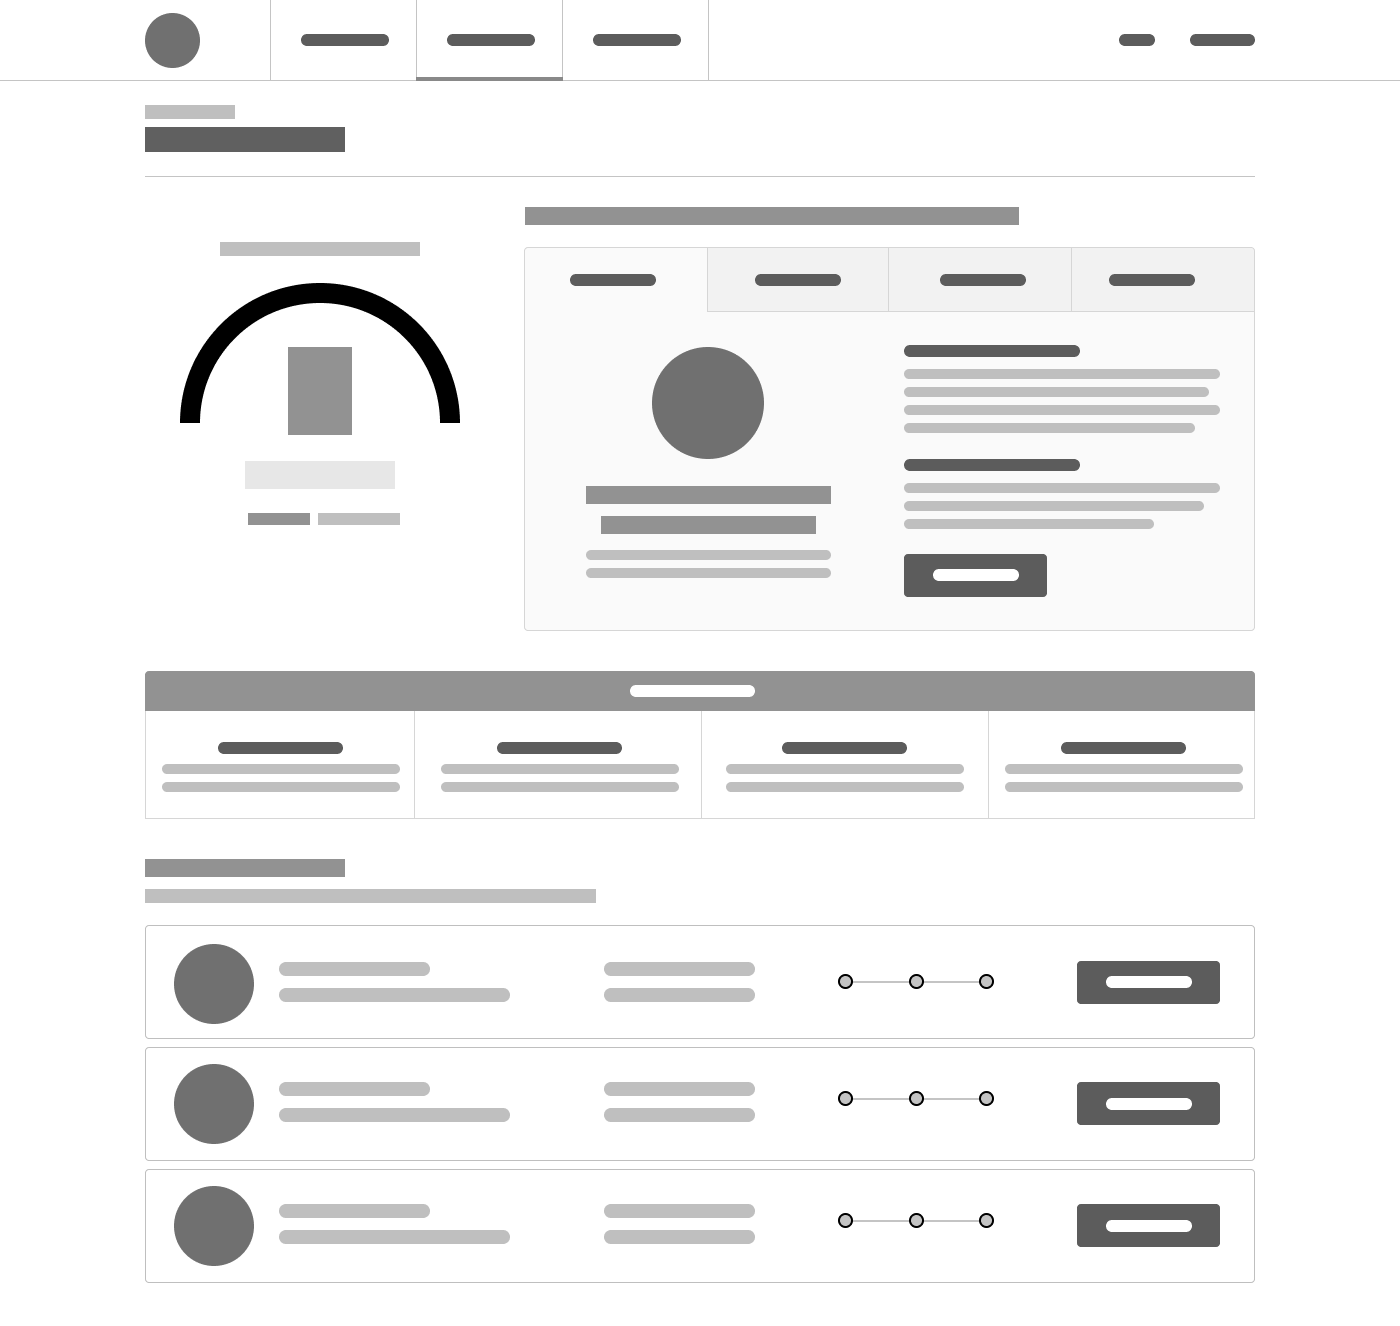
The next step was to expand upon the wireframes. Using the wireframes, I added the text and other visual components to get a better idea of how each section might work. Throughout this stage of the process, I would do bi-weekly feedback sessions and use the feedback to refine the designs.
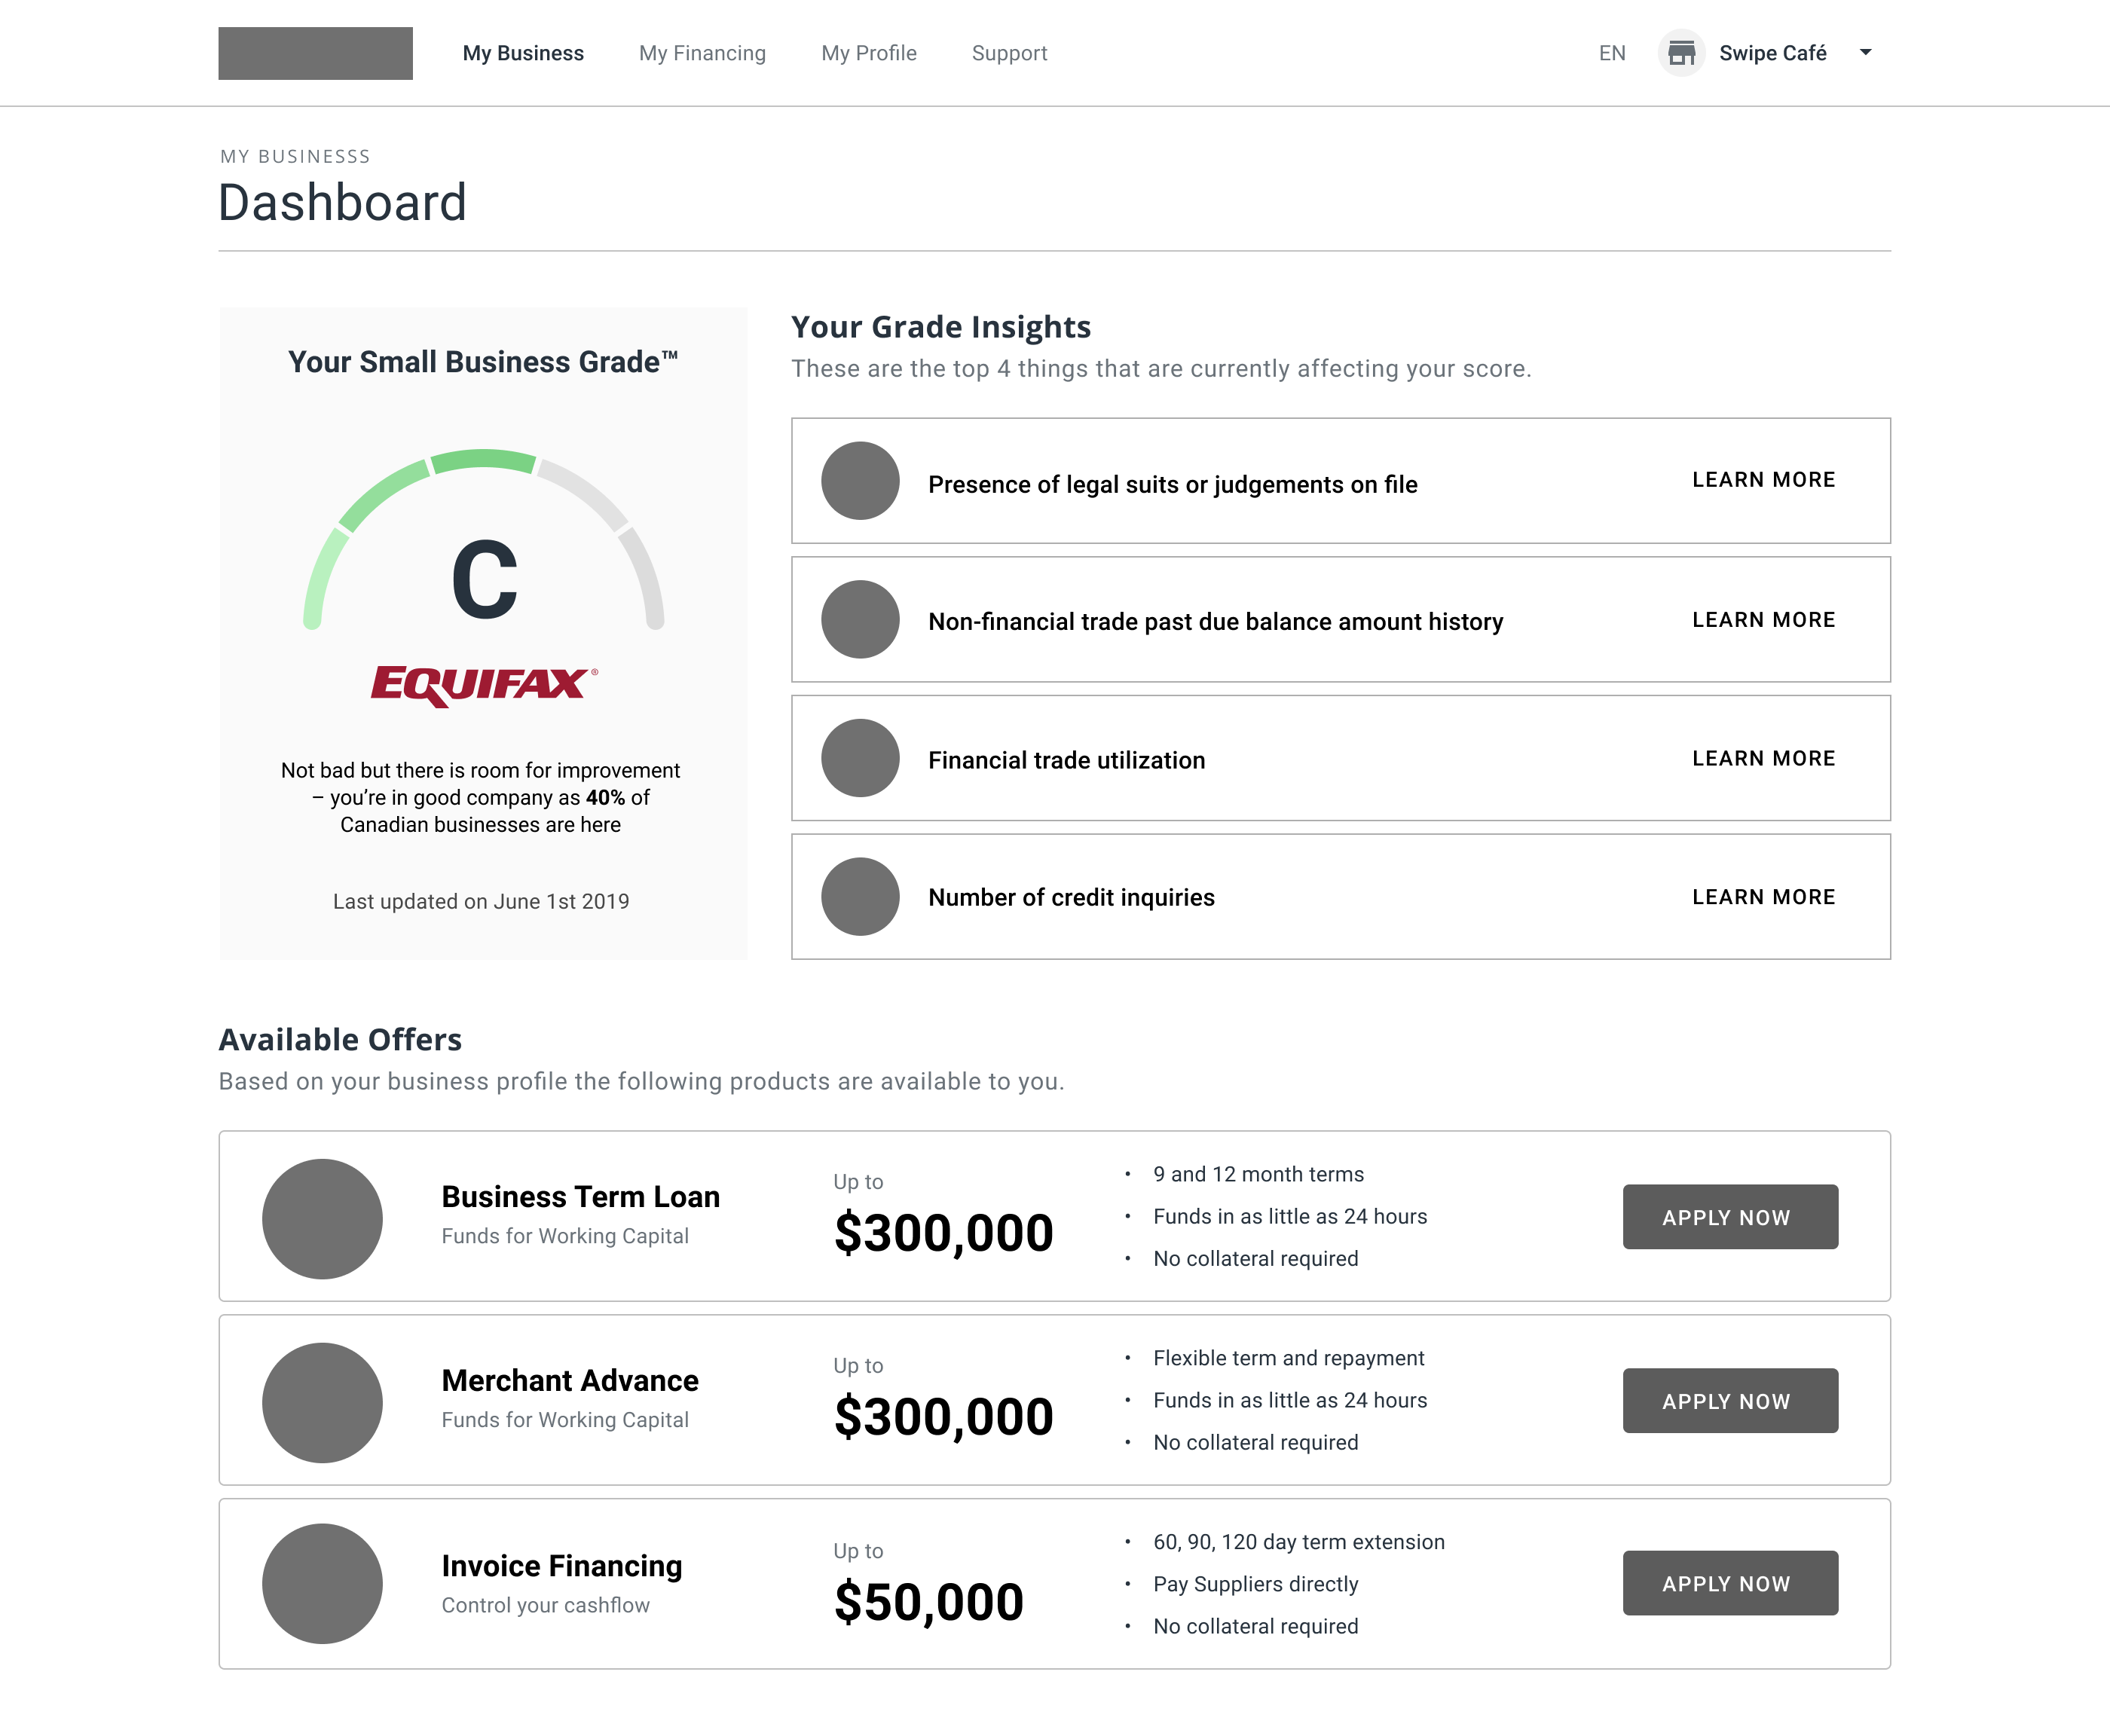
The launch version of the product was created and launched with our partners at Money Mart. We learned a lot through talking to agents and customers about how we could improve the process—using all the feedback to improve upon the product.

Money Mart Testable Launch Version
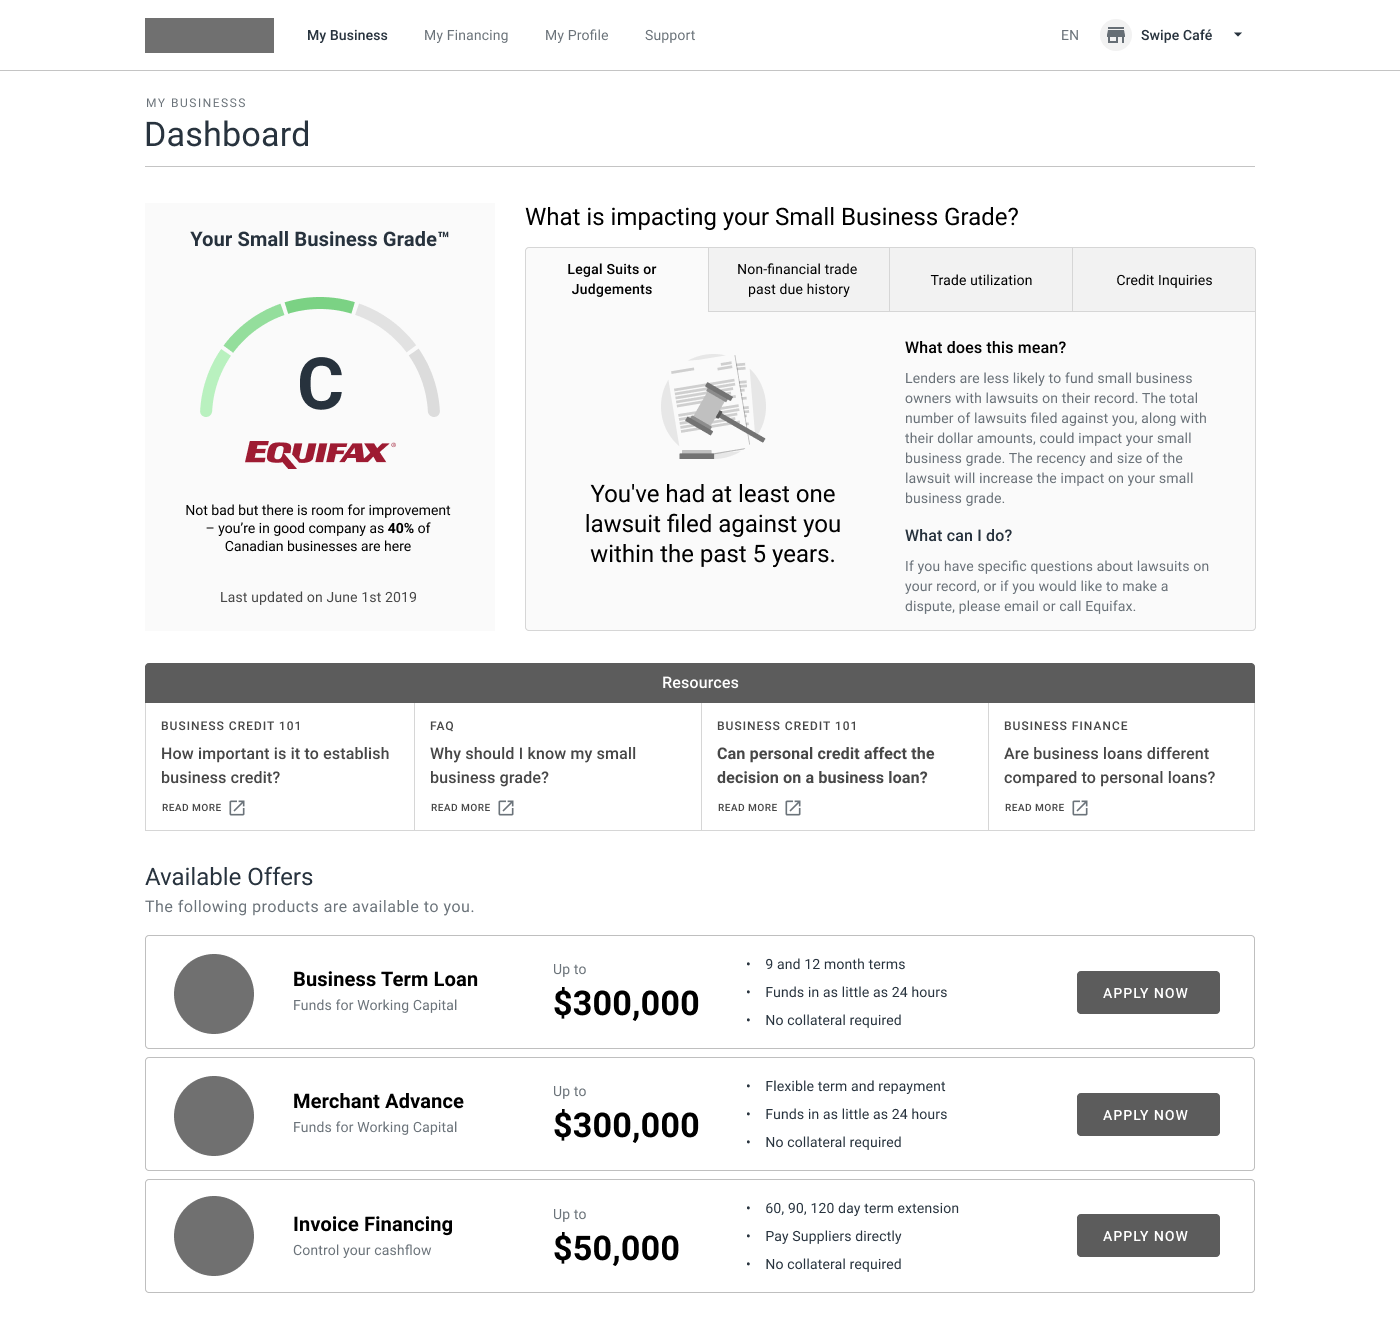
We took the feedback we gathered to improve various areas of the product. We developed technics to improve the accuracy of the grade. We added impact factors with descriptions and advice on how to improve. Introduced email notifications for the monthly grade refresh, and add the ability to opt-out of the service online.
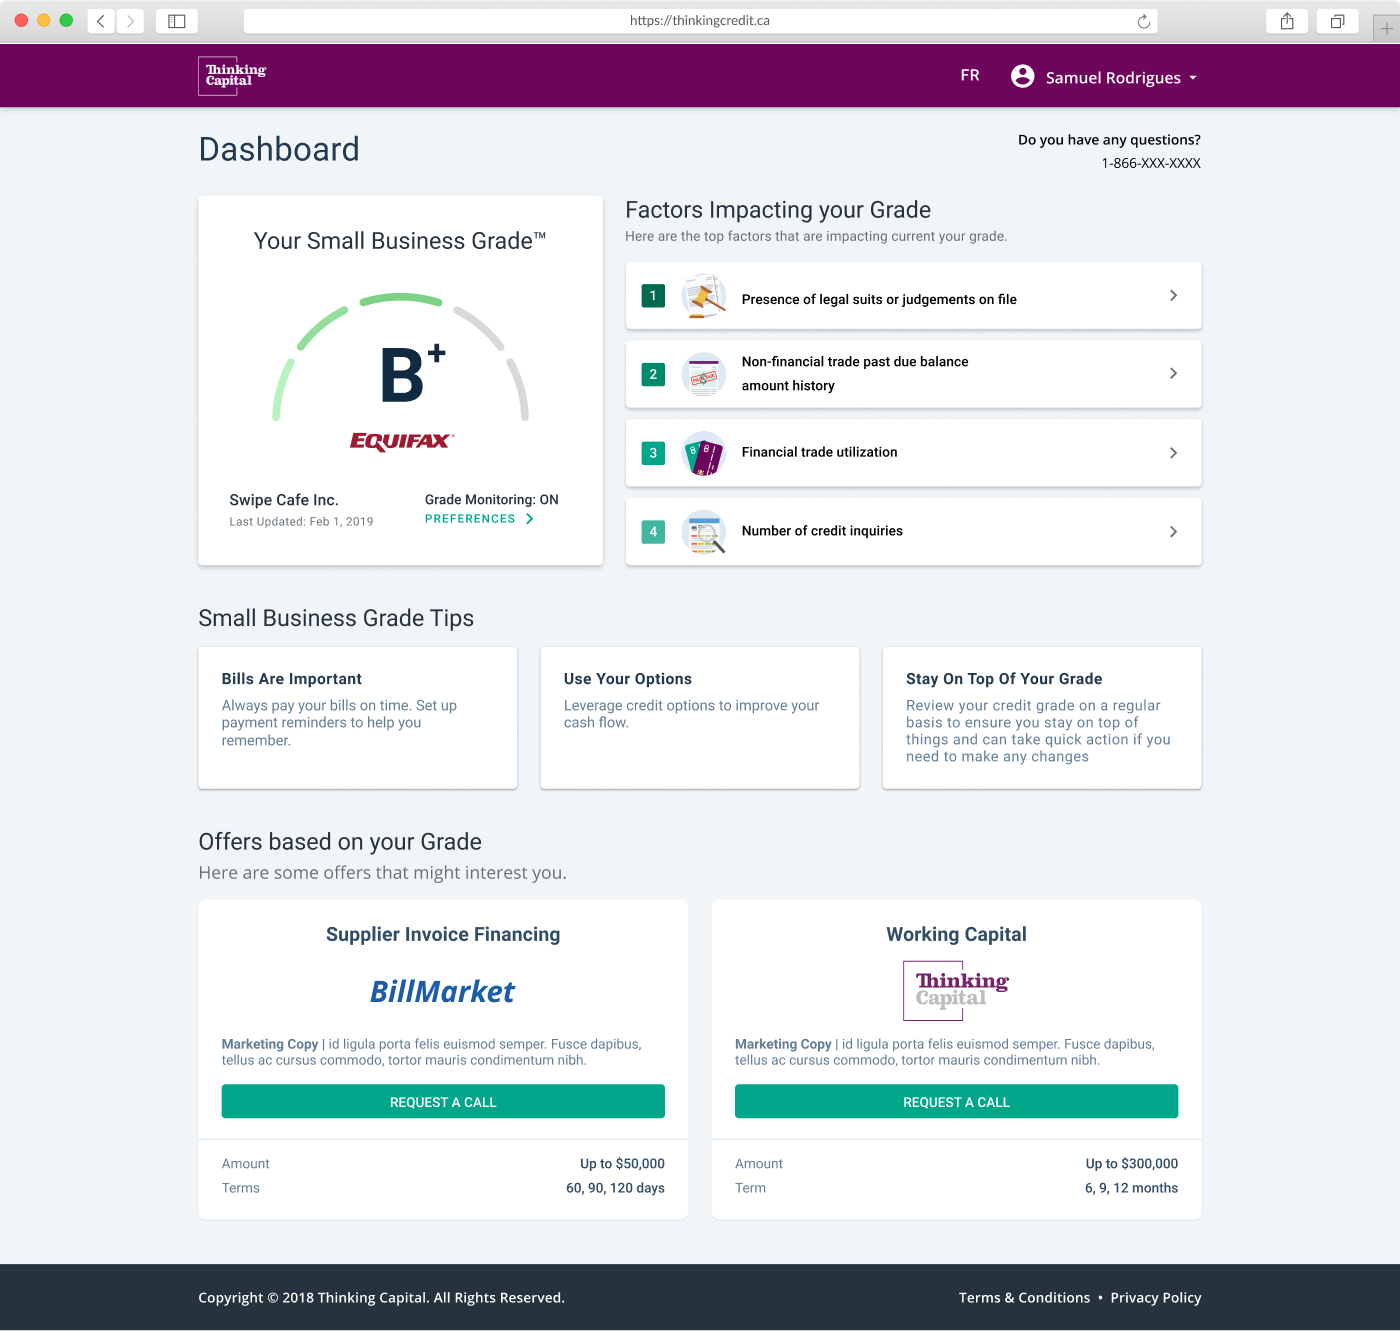
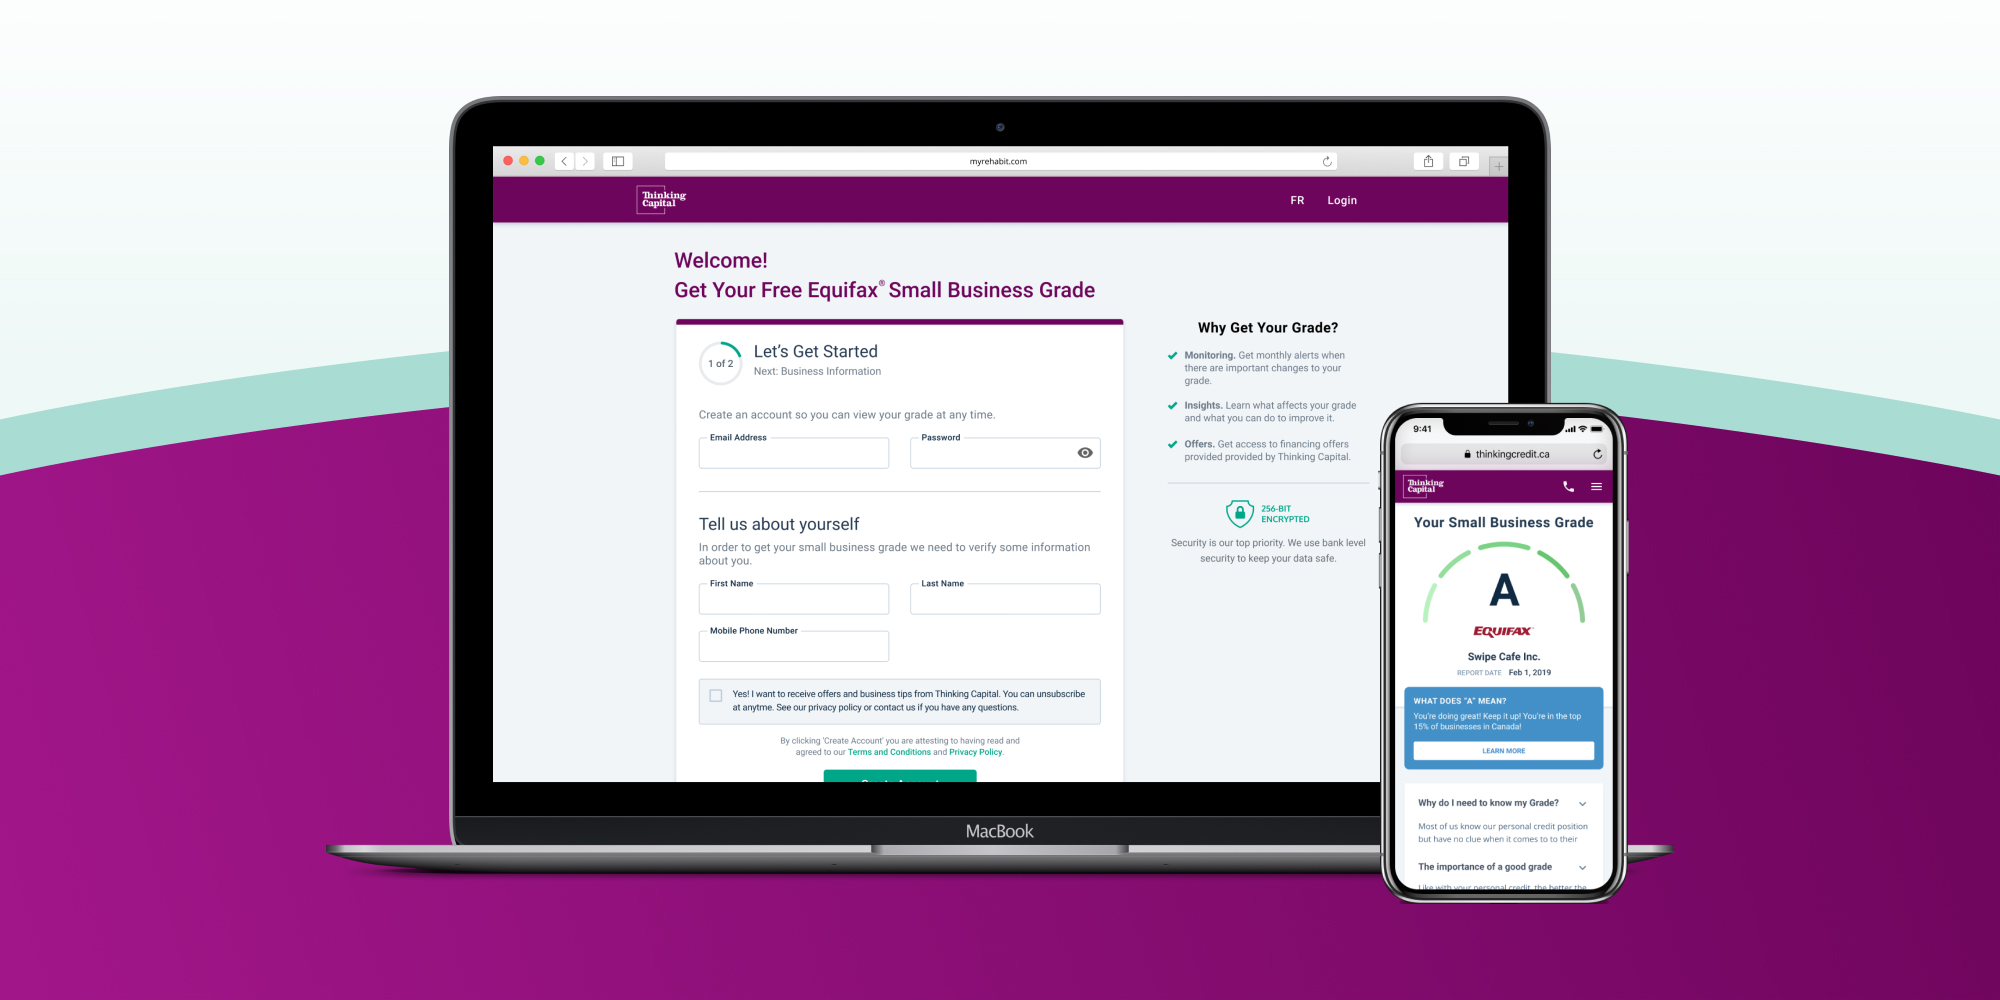
Self-Serve Launch Version
For the new dashboard, we knew that if we wanted the grade to be useful, it had to get more granular. So made some changes on the back end to add + and - levels to each grade (A+, A, A-, B+, B, B-..etc). The changes we made would help the customer see their progress monthly.
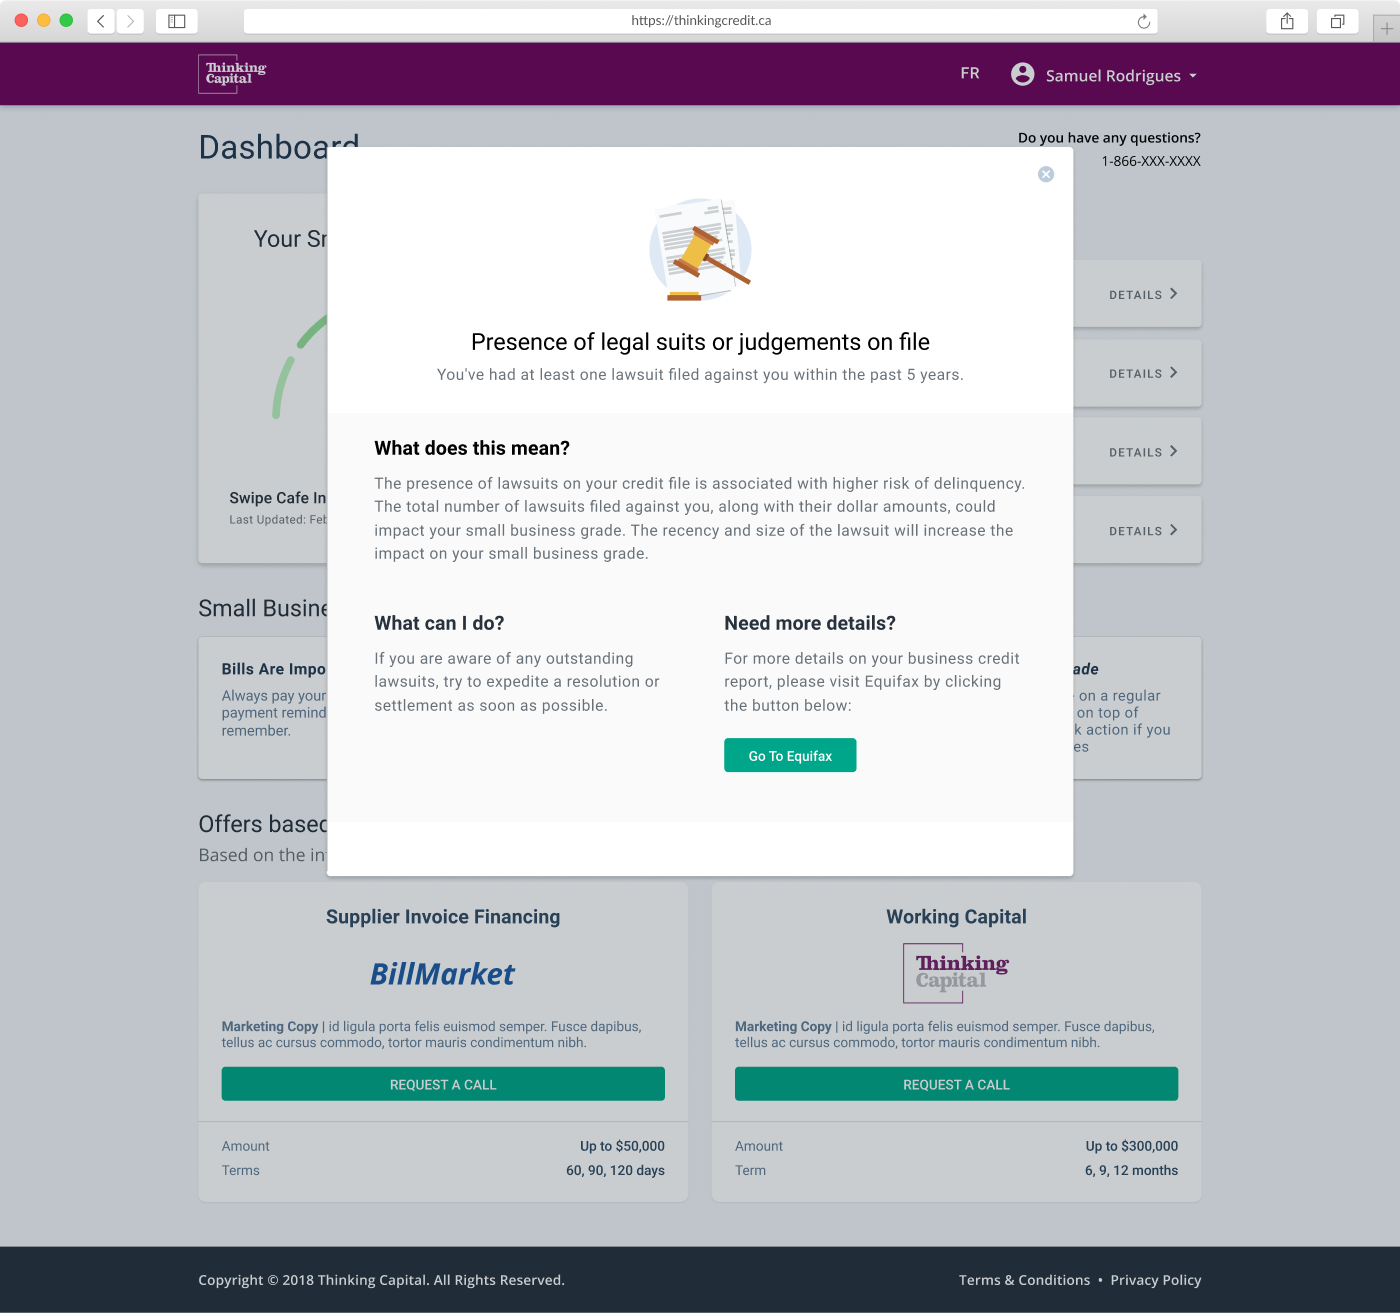
Alongside their grade, every customer would see impact factors. We would rank them based on severity. Each impact factor would have a detailed summary that included what it means, what can be about it, and additional resources to help solve each issue.
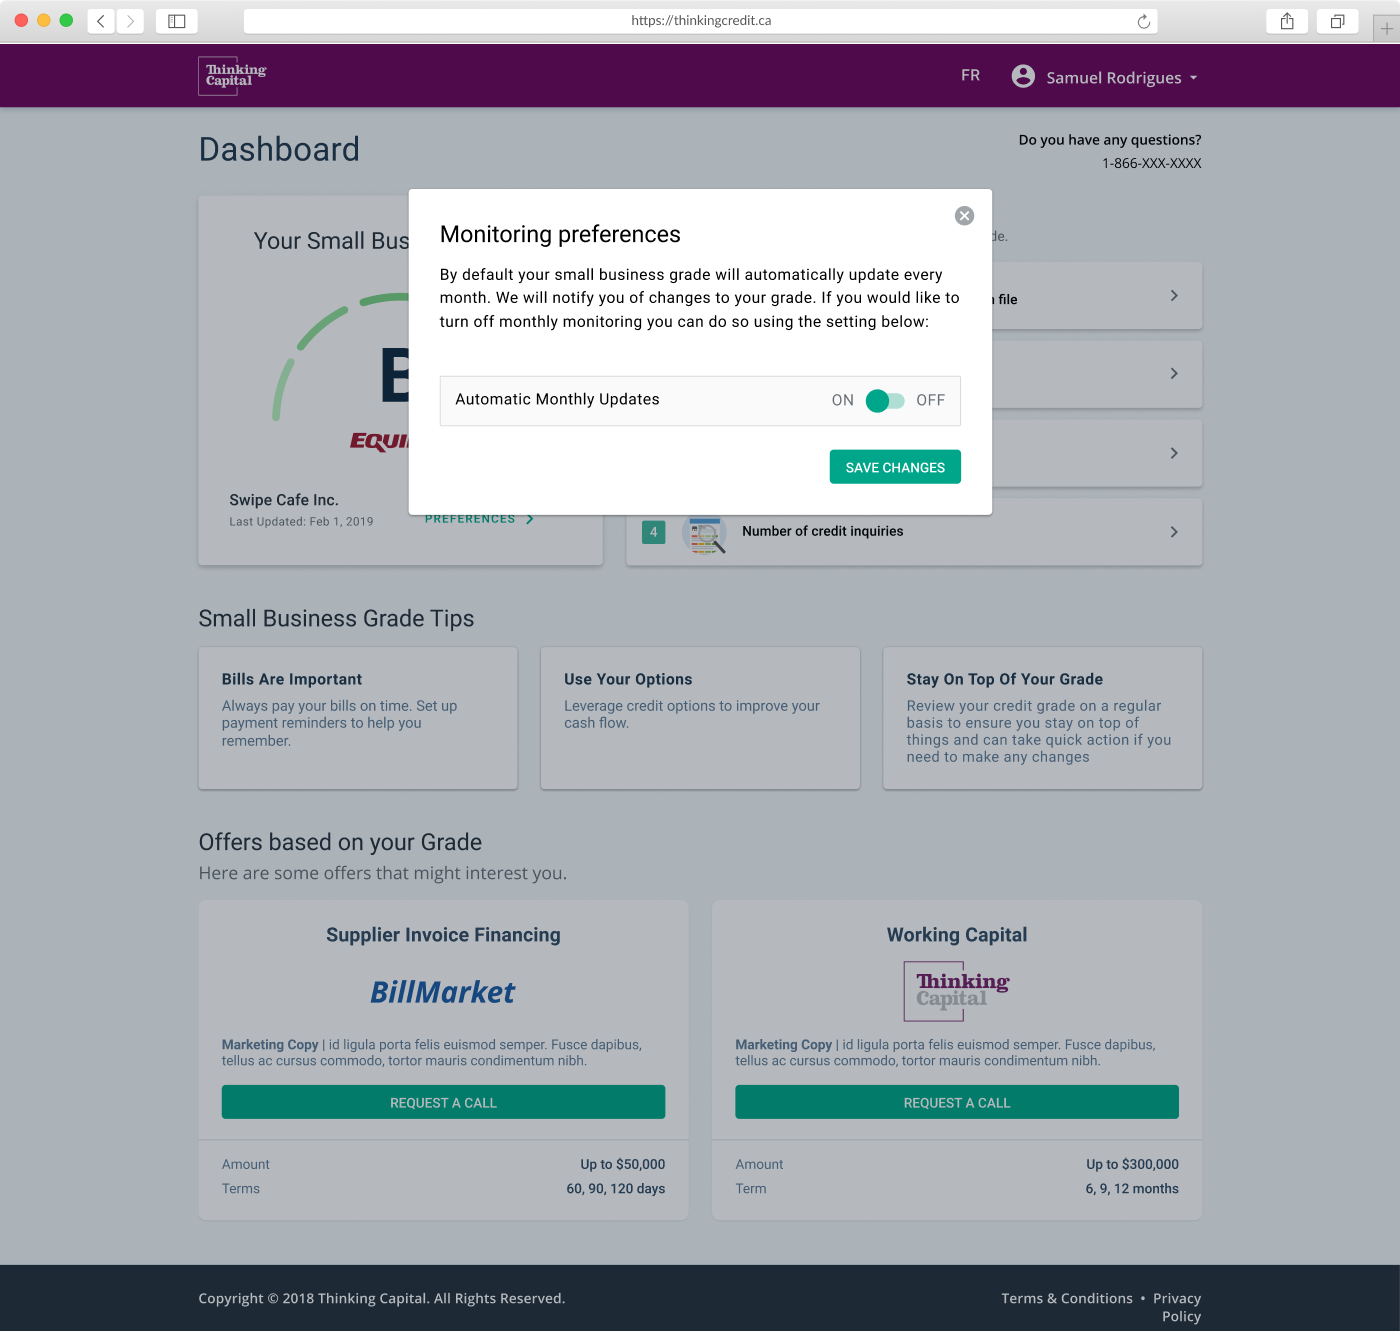
With the final version of the product, we introduced monthly monitoring. We would refresh the grade automatically and inform a customer of any changes. These alerts would come in the form of a monthly email with a link to the dashboard. We also included a means to opt-out of monitoring for those who no longer wanted it.